Debugging Custom Scenario DLLs
Since we do not have access to the Outpost 2 source code or program debug database (PDB file), we cannot step through the Outpost 2 executable code or compare the stack trace with source code. However, we can still debug custom scenario DLLs.
In order to debug your DLL, follow the required steps from previous sections to ensure a copy of all required files (mission DLL, MAP file, tech tree file, etc) are contained in the Outpost 2 root directory. Then ensure your Visual Studio project is linked to Outpost 2.
- Recompile your project if needed.
- Set a break point where you want to examine the code or perform whatever other debugging action.
- Press Start Debugging (or hit F5). Outpost 2 should load normally. Once Outpost 2 accesses your DLL, Visual Studio should pause the program at the break point and let you examine the stack trace.
Note: Visual Studio must have access to your scenario's PDB (Program Debug Database) file for debugging. The PDB file is rebuilt every time you recompile a scenario. Visual Studio will automatically find the PDB file in your project directories and copying the PDB to the Outpost 2 directory is not required.
Debugging Multiplayer Scenarios
Multiple instances of Outpost 2 may be opened on the same computer. From multiple open instances of Outpost 2 on the same computer, TCP/IP games may be ran without issue. This allows for testing Outpost 2 multiplayer scenarios without requiring multiple computers. Setting and stepping through breakpoints within Visual Studio will not break Outpost 2 network links.
Opening multiple Instances of Outpost 2 From Visual Studio
- Ensure the Outpost 2 executable is referenced in your solution as described on the Advanced Projects Page.
- Compile and transfer the required files to the Outpost 2 directory. To automate the process, see the Advanced Projects Page section on Post Build Events.
- Open Outpost 2 from Visual Studio for debugging.
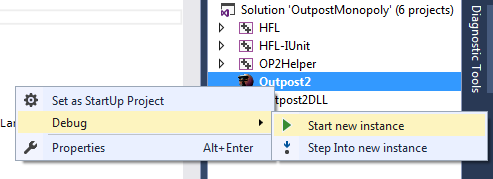
- From the Solution Explorer: right click on the Outpost 2 executable → Debug → Start New Instance.
- Start the multiplayer scenario and debug as needed.
- Go Back to Outpost 2 Software Development Kit
- Go Back to Outpost 2 Main page
- Go Back to Wiki Home Page

